How we connected 30 price comparison APIs, BigQuery, and Azure to create a unified marketing data hub
How we connected 30 price comparison APIs, BigQuery, and Azure to create a unified marketing data hub
In today’s performance marketing, data isn’t just numbers — it’s decisions, budgets, and actual revenue.
But what if your cost data is scattered across dozens of different sources?
In this project, we set out to solve that problem by building an end-to-end marketing data platform that connects cost data from 30+ price comparison websites, advertising platforms, CRM systems, and analytics exports into one unified ecosystem.
🧩 Project Overview
Our main goal was to create a central tool for marketing cost integration and attribution — a system that both marketing and category managers could rely on.
We aimed to:
- eliminate data silos between marketing channels,
- automate data collection and processing,
- and implement consistent attribution models (Last Click, Time Decay, U-Shape).
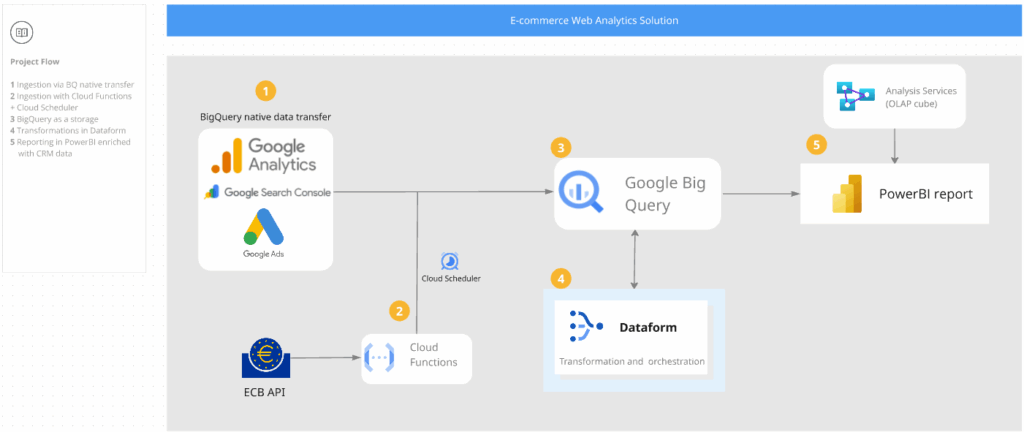
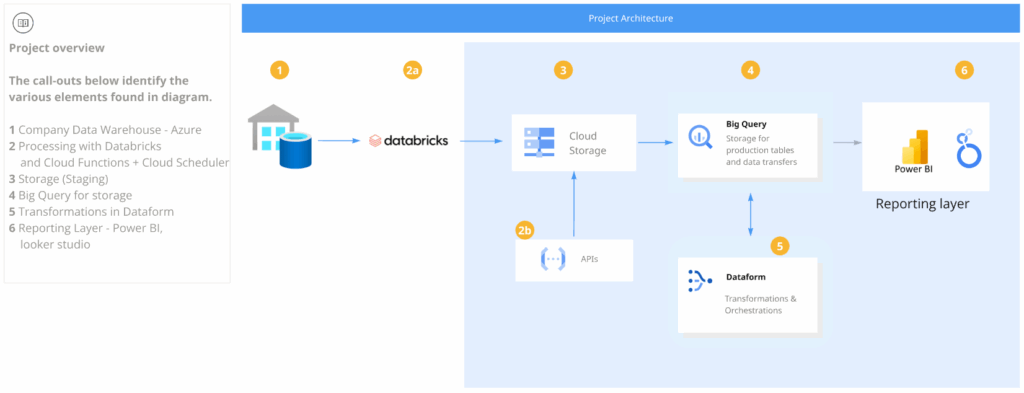
☁️ Architecture at a Glance
Below is a simplified overview of the system architecture:
- Company Data Warehouse (Azure) – primary source for CRM and product data.
- Processing Layer – Databricks & Cloud Functions – collects and processes external API data.
- Storage (Staging) – Google Cloud Storage – intermediate Parquet data layer.
- BigQuery – main analytical data warehouse.
- Dataform – for data modeling and orchestration.
- Reporting Layer – Power BI & Looker Studio – final dashboards for business users.
🖼️ [Placeholder: insert architecture diagram — e.g., GCP + Azure + Databricks + BI flow chart]
🔄 From APIs to Insights — How the Data Flows
1. Collecting Cost Data
We pull cost and performance data from 30+ price comparison APIs (including Kelkoo, Zbozi, Ceneo, and others).
Data ingestion and normalization happen in Databricks, allowing us to scale workloads and parallelize API calls efficiently.
💻 [Placeholder: short code snippet — example Databricks notebook calling external APIs and writing to Parquet]
2. Storage & Integration
All raw data is saved in Parquet format inside Google Cloud Storage (staging) for efficient querying and downstream use.
Next, we load this data into BigQuery, where it’s joined with:
- GA4 export tables,
- Google Ads and Facebook Ads cost data,
- and product data from Azure Data Warehouse.
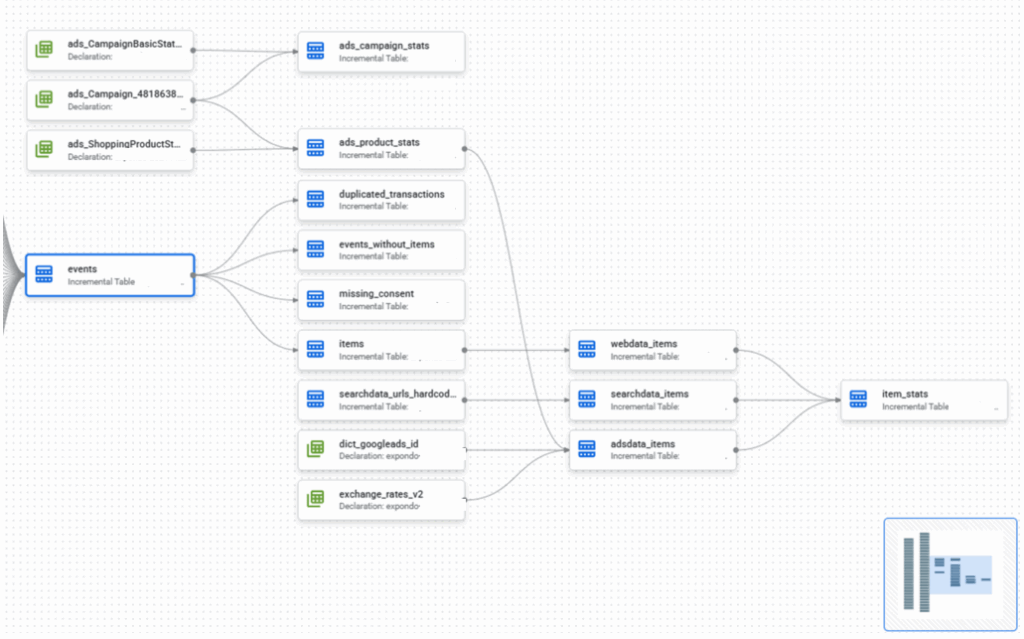
3. Data Modeling & Attribution
Inside Dataform, we orchestrate and model the data transformations.
This includes:
- standardizing table structures,
- unifying cost and revenue sources,
- and enriching with attribution models — Last Click, Time Decay, and U-Shape.
💻 [Placeholder: short SQL or Dataform snippet — attribution logic or transformation model]
This gives us a unified, transparent view of marketing efficiency across all channels.
4. Currency Exchange Module
To ensure accuracy across multiple currencies, we built a Currency Exchange module using Google Cloud Functions.
It periodically fetches exchange rates from the NBP API and updates BigQuery tables automatically.
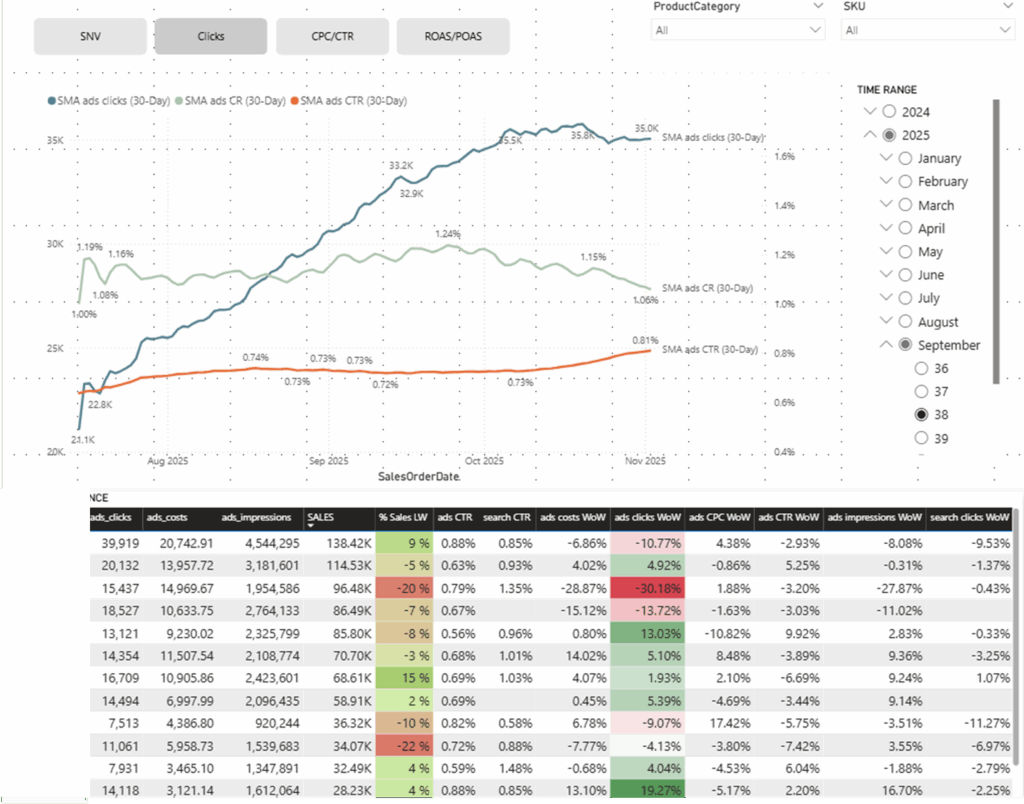
📊 Reporting & Business Value
We separated the reporting layer by user needs:
- Looker Studio → for marketing teams: performance dashboards, CPC, ROI, and attribution analysis.
- Power BI → for category managers: product- and margin-oriented reports, combined with CRM insights.
This architecture enables business teams to:
- see complete marketing costs in one place,
- make faster budget decisions,
- and manage cross-channel attribution with confidence.
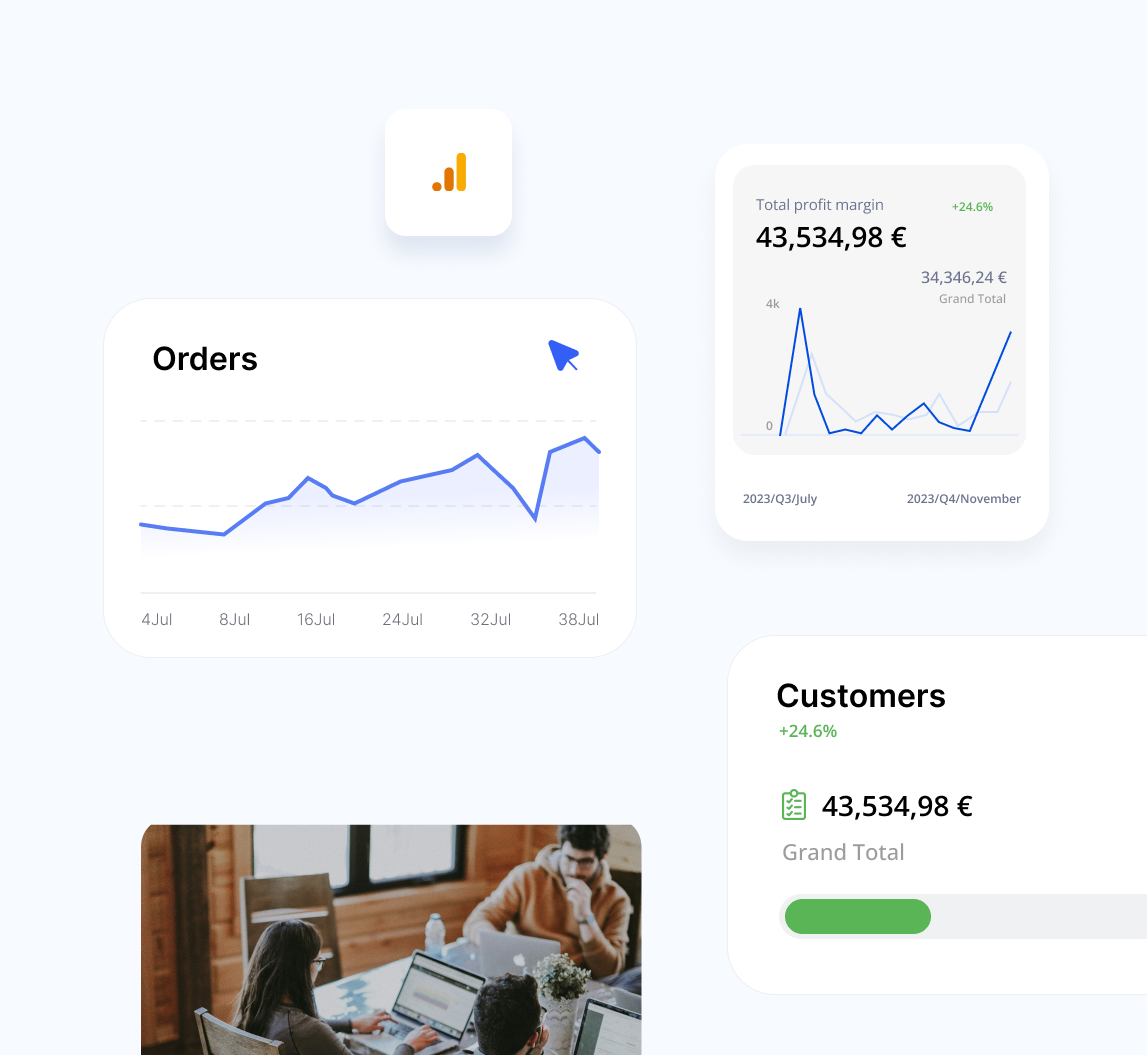
🖼️ [Placeholder: dashboard screenshot — Looker Studio or Power BI view]
🚀 What’s Next
Future development areas include:
- Anomaly detection and alerting for cost spikes,
- introducing a data-driven attribution model,
- and deeper automation within Dataform and Databricks.
💡 Takeaways
This project shows how a modern, cloud-based data stack can unify scattered marketing sources into a single, actionable platform.
Instead of juggling CSV exports and spreadsheets, we now have a scalable, automated, and transparent system that empowers teams to focus on insights — not data cleaning.